How Saothair’s CFO built his own portfolio dashboards with Lumonic’s MCP

Carter Youngblood
Saothair Capital Partners’ first CFO uses Lumonic’s MCP to build portfolio dashboards and valuation files on his own with real-time, auditable numbers flowing from Lumonic.
This is a follow-up to our first Saothair Capital Partners story, covering how the firm deployed private equity portfolio monitoring. That piece is about the platform. This one is about what Robert Sobieski, Saothair’s first CFO, started building on top of it once the data underneath was clean, using Lumonic’s MCP and the Claude add-in for Excel.
Where it started
Robert has built portfolio dashboards before. Years ago, as an associate, it took weeks. When it was done, it was locked. The team updated the data but never touched the structure, and tracing any number back to its source was nearly impossible. Someone questions a revenue figure from eleven months ago, and you are either defending it from memory or going back to reconcile it.
At Saothair, a private equity firm with eight employees, the deal team is busy closing and sourcing. There is no one to hand a build off to, and even if there were, it would mean pulling someone off something more important. Robert needed portfolio-level views he could build and own himself.

The approach
Build, then iterate
Robert had been using large language models for a while and had tested other connectors. Most did not last. You ask a question, the output is subpar, you move on. When he learned Lumonic had an MCP, he did not wait for a walkthrough. He found the documentation himself, connected it to Claude Desktop, and started in the same session. His first prompt was a screenshot of a Lumonic dashboard with one instruction:
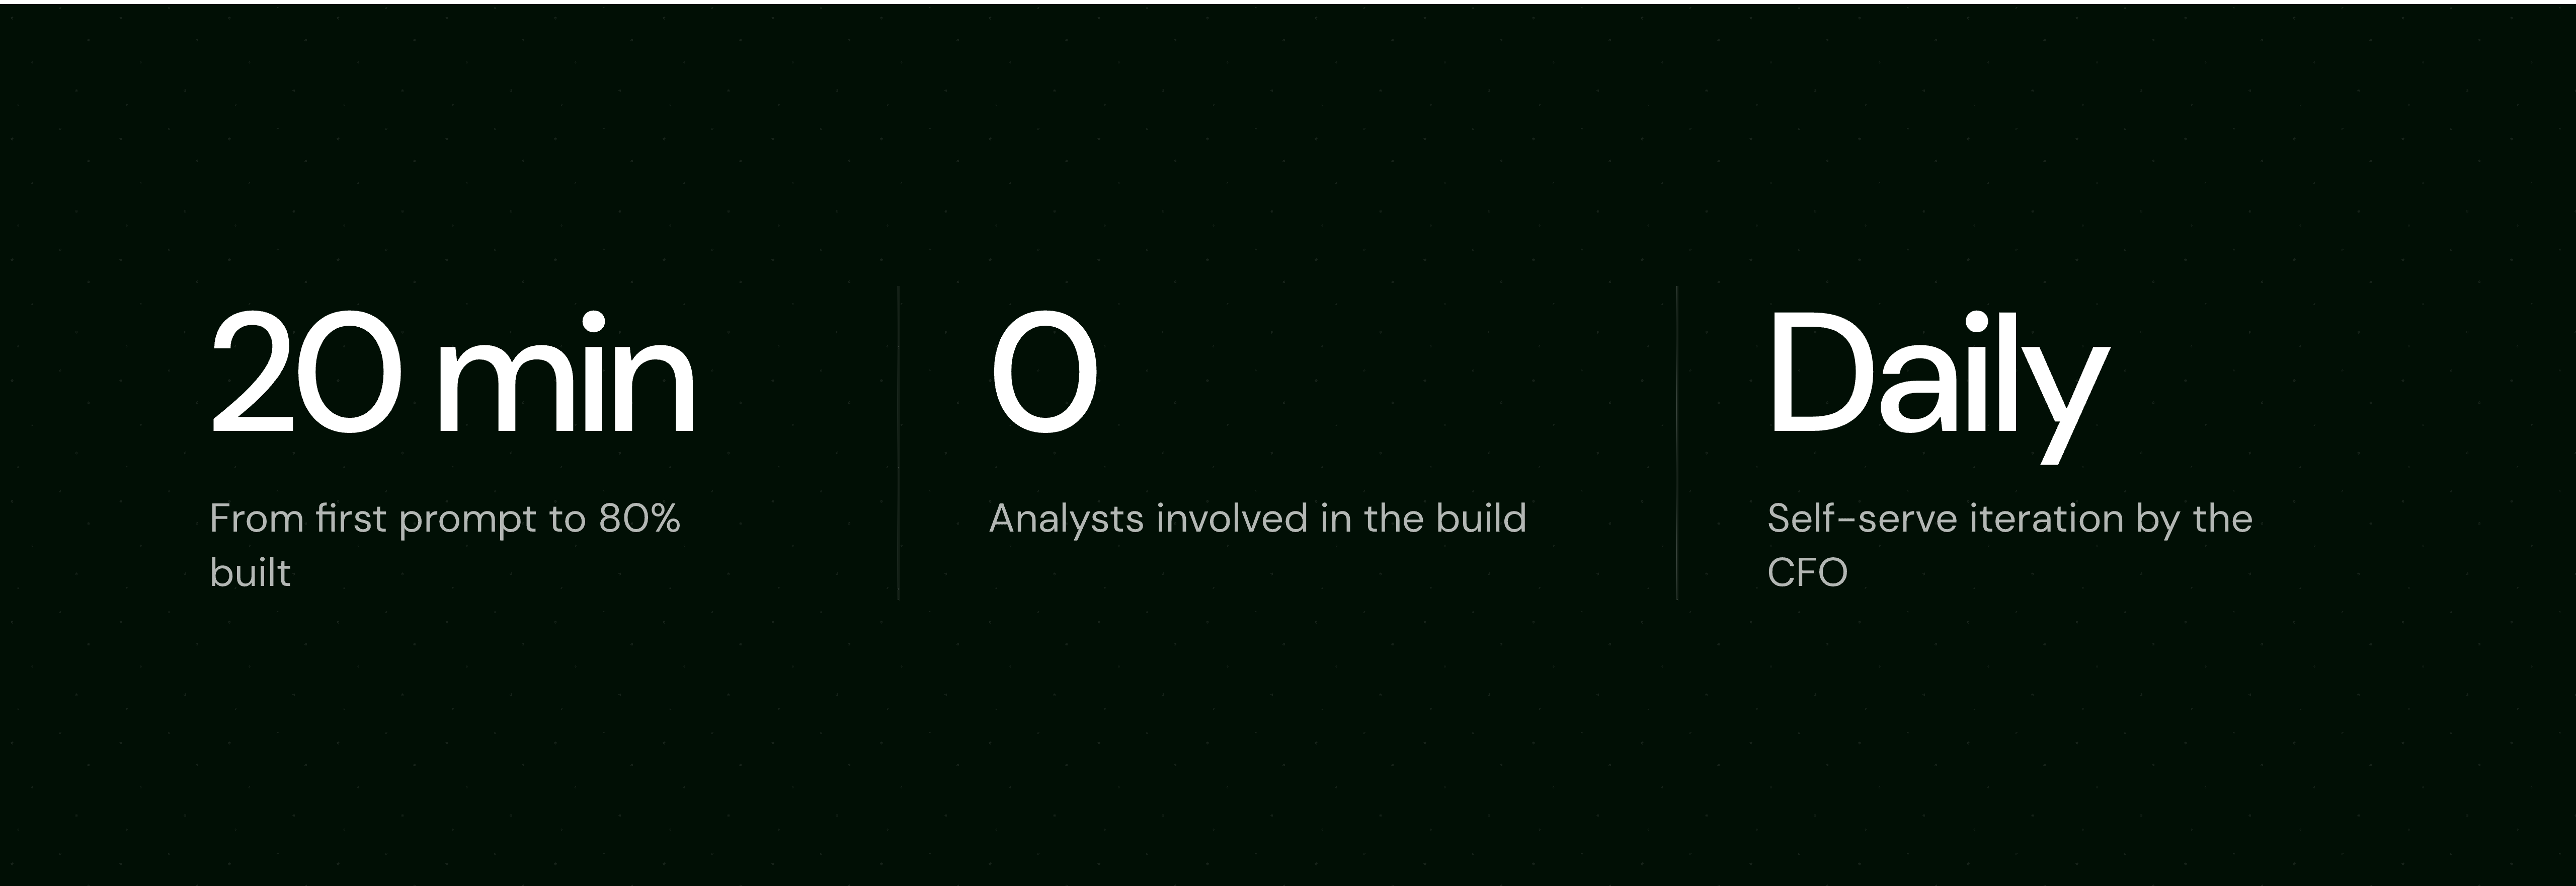
Most of what he needed was already there. The data model, the field language, the company-level metrics, all accounted for. He was 70 to 80 percent of the way there in about twenty minutes, and the full file came together in a single evening. Because the first result was that accurate, he kept going. One question led to the next.

His workflow now runs in two phases. He starts on Claude Desktop to build: a screenshot or a description, a direction, and the model does the heavy lifting. Then he switches to Excel to fine-tune with the Lumonic & Claude for Excel plugins: fixing formulas, adjusting formatting, adding a new metric when someone asks for one. The base file came together in an evening; the ongoing work is a few minutes a day.
What the file actually does
The workbook Robert built is driven by a single Control tab with a company dropdown. Change the selection and every tab reflows, all dates, all financials, all metrics, to the company he picked. Behind it sit a Dashboard, Monthly P&L, Balance Sheet and Credit, Budget and Prior-Year Comparison, and a KPI Inputs tab. Every number is a live Lumonic formula, so the file is not a snapshot; it stays current against the source and each cell traces back to where the figure came from.
Valuations from two connectors
Once the dashboard worked, Robert combined the Lumonic and PitchBook connectors in a single file to rebuild the firm’s valuation template. He fed Claude his last two quarters of valuation files and asked it to build a standard template across all portfolio companies, with the Lumonic connector supplying the financials and the PitchBook connector supplying forward-looking trading multiples.
The result
Daily access to data he used to wait for
The dashboard Robert built in just a few hours would have taken him at least a full day in Excel, and that figure only covers the structure. Collecting the data, verifying it is current, and reconciling anything that changed are separate tasks on top of it.
Time is only part of the story. The bigger part is that the data underneath is clean and verifiable. Lumonic pulls financial data directly from portfolio company source files, structures it, keeps it current, and allows users to directly traceback to the line item of the original file it came from. By the time Robert asks Claude to build something, the data is already there and already right. That is what makes the whole workflow possible.
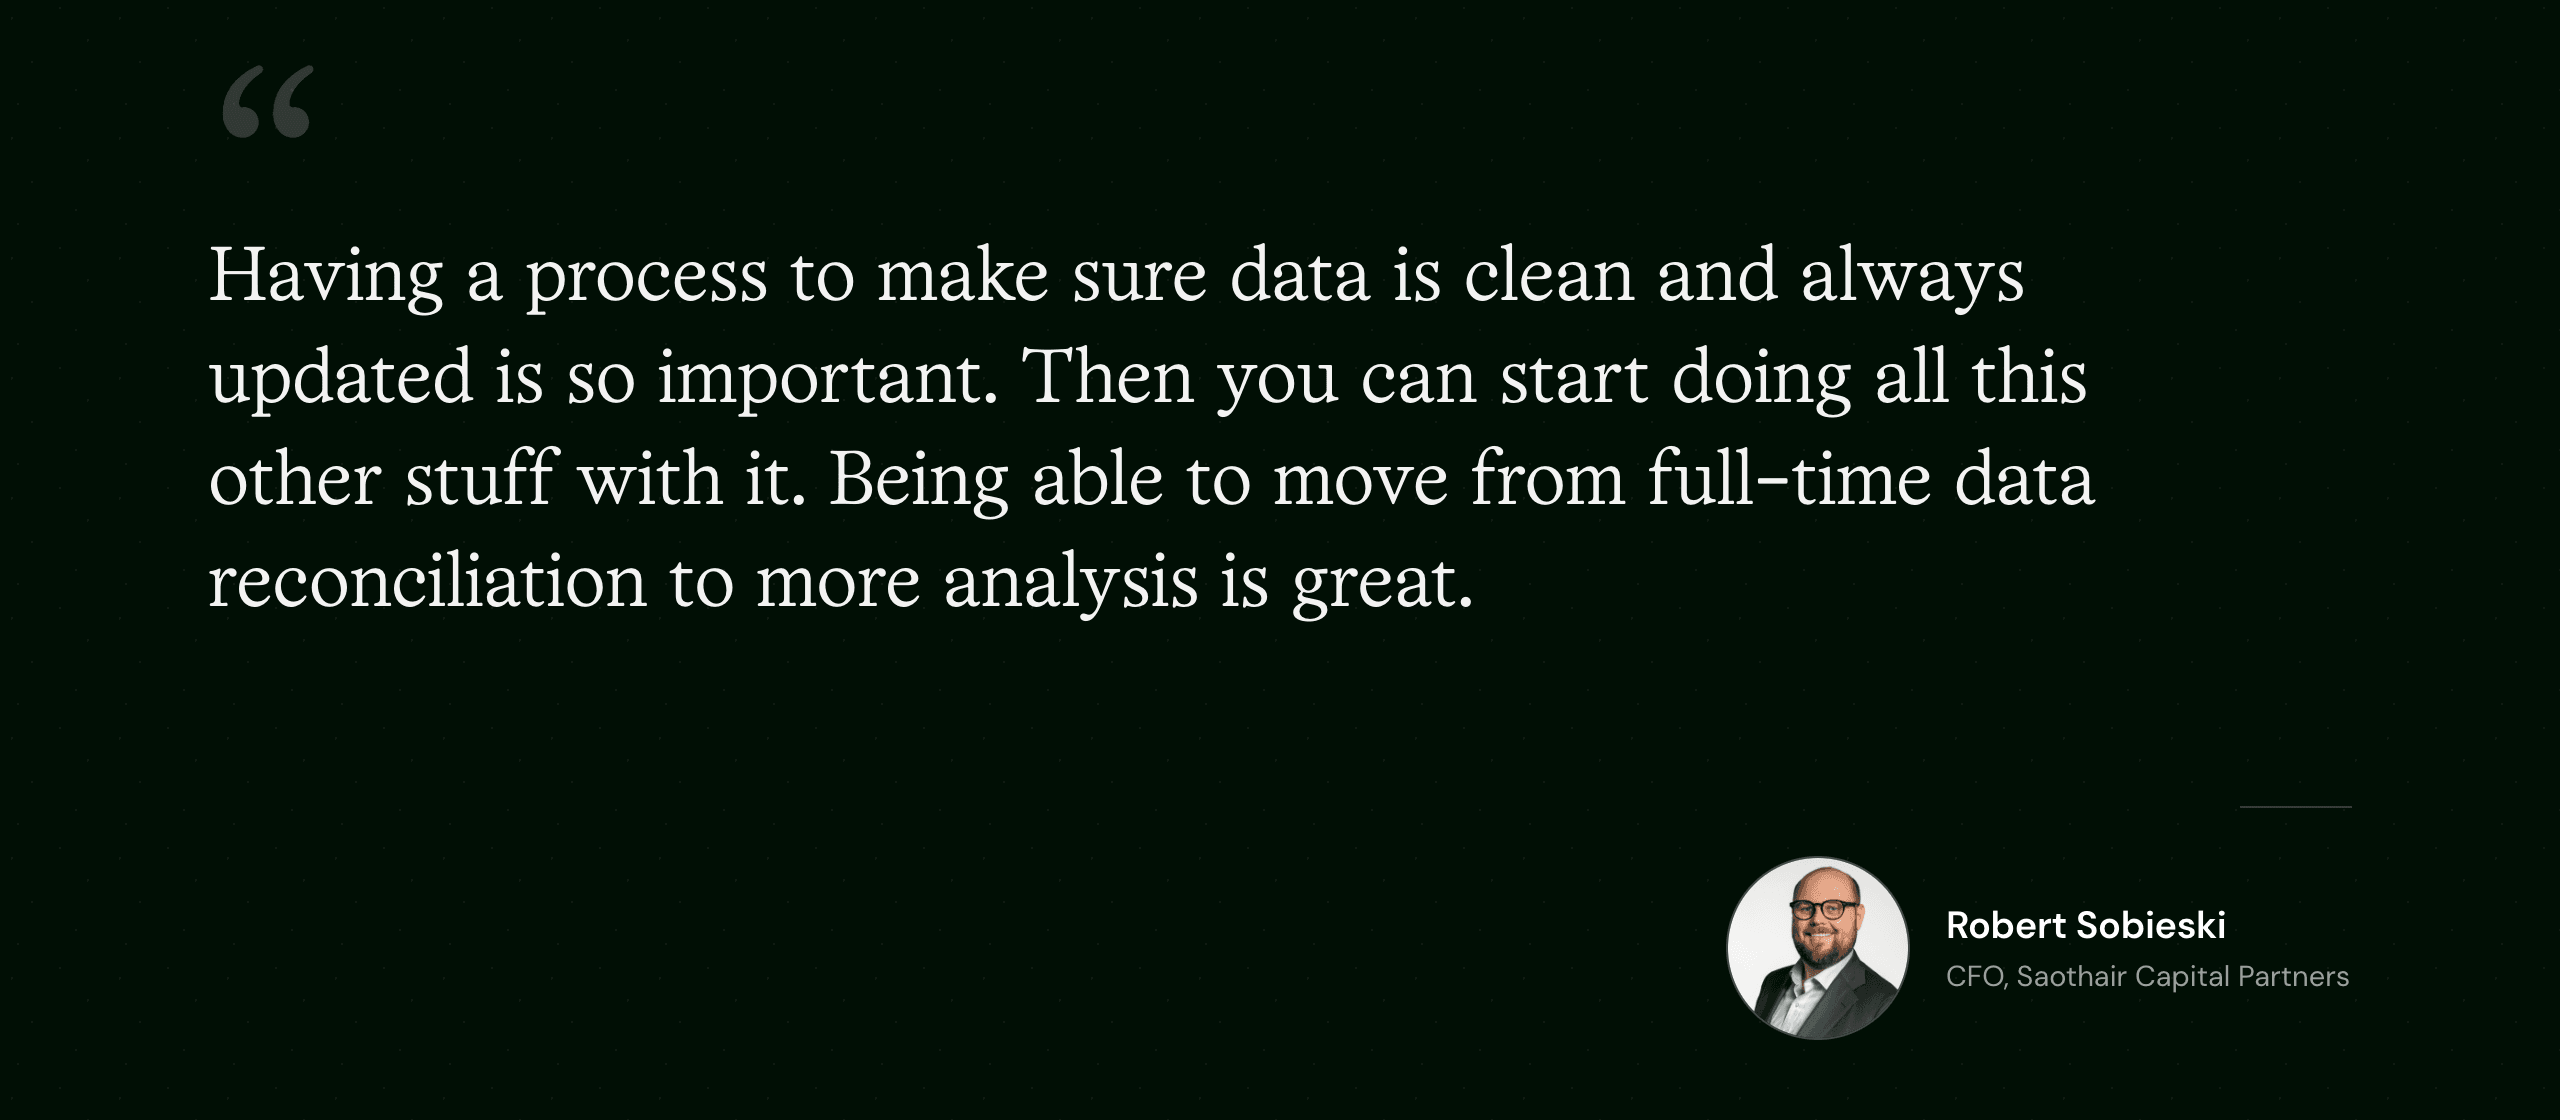
Robert now opens the file daily and iterates as needs change. He does not have to wait for someone else to build the view he wants, and he does not have to translate what he is looking for into a task for an analyst. He asks, it builds, he iterates. In his words, it was basically telling an analyst what to build and having them build it for him.
Advice he gives other CFOs
Robert has been recommending Lumonic to peer CFOs. Each one he has asked is using some form of large language model, but most are still figuring out how. His advice: start broad. Give it a direction and see what it builds before you try to be specific. But none of it works, he will tell you, if the data on the other end is not worth building on.
Results
Task | Before | With the MCP |
|---|---|---|
Portfolio dashboards | Weeks of analyst build, then locked | Built in an evening, owned and iterated by the CFO |
Data access | Wait on the deal team | Self-serve, on demand, daily |
Valuations | Manual template, rebuilt each cycle | PitchBook and Lumonic in one live template |
Reconciliation | Full-time effort | Clean at the source, freeing time for analysis |
Traceability | Nearly impossible after the fact | Every number traces to its source |
What’s next
With the dashboard and valuation files working, Robert is combining connectors further and moving toward generating a monthly reporting pack for every portfolio company from a single prompt once the data is in. The question has shifted from how to build the view to what else the data can do.
Ready to see Lumonic in action?
Request a demo with our team to learn more.
